中商官網
中商官網
 數據庫
數據庫

2014 Deep Research Report on Global and China EPDM Industry
2014 Deep Research Report on Global and China EPDM Industry

<2014 Deep Research Report on Global and China EPDM Industry> was professional and depth research report on Global and China EPDM industry.In a word, it was a depth research report on China EPDM industry. And thanks to the support and assistance from EPDM industry chain related technical experts and marketing engineers during Research Team survey and interviews.
【Report Name】:2014 Deep Research Report on Global and China EPDM Industry
【Published】:Oct/2014
【Report Code】:QY
【Report Pages】:130
【Report Charts】:136
【Form】: PDF or Hard copy
【Delivery】: E-mail or EMS
【Report Price】:Hard Copy: 2200 USD
PDF Copy (single user): 2200 USD
Global License: 4200 USD
【Telephone】:0755-25407713 Online QQ:1113842166
company WEB SITE ://www.askci.com
【Abstract】:
<2014 Deep Research Report on Global and China EPDM Industry> was professional and depth research report on Global and China EPDM industry. The report firstly introduced EPDM basic information included EPDM definition classification application industry chain structure industry overview; international market analysis, China domestic market analysis, Macroeconomic environment and economic situation analysis, EPDM industry policy and plan, EPDM product specification, manufacturing process, cost structure etc. then statistics Global and China key manufacturers EPDM capacity production cost price profit production value gross margin etc information, and Global and China EPDM capacity production market share supply demand shortage import export consumption etc data statistics, and EPDM 2009-2014 capacity production price cost profit production value gross margin etc information. And also listed EPDM upstream raw material and downstream analysis and EPDM marketing channels industry development trend and proposals. In the end, the report introduced EPDM new project SWOT analysis Investment feasibility analysis investment return analysis and also give related research conclusions and development trend analysis on China EPDM industry. In a word, it was a depth research report on China EPDM industry. And thanks to the support and assistance from EPDM industry chain related technical experts and marketing engineers during Research Team survey and interviews.
Table of Content
Chapter One EPDM Industry Overview 1
1.1 EPDM Definition 1
1.2 EPDM Classification and Application 2
1.3 EPDM Industry Chain Structure 2
1.4 EPDM Industry Overview 2
Chapter Two EPDM International and China Market Analysis 3
2.1 EPDM Industry International Market Analysis 3
2.1.1 EPDM International Market Development History 3
2.1.2 EPDM Product and Technology Developments 3
2.1.3 EPDM Competitive Landscape Analysis 4
2.1.4 EPDM International Key Countries Development Status 5
2.1.5 EPDM International Market Development Trend 6
2.2 EPDM Industry China Market Analysis 6
2.2.1 EPDM China Market Development History 6
2.2.2 EPDM Product and Technology Developments 6
2.2.3 EPDM Competitive Landscape Analysis 7
2.2.4 EPDM China Key Regions Development Status 7
2.2.5 EPDM China Market Development Trend 8
2.3 EPDM International and China Market Comparison Analysis 8
Chapter Three EPDM Development Environmental Analysis 10
3.1 China Economic Environment Analysis 10
3.1.1 China GDP Analysis 10
3.1.2 China CPI Analysis 11
3.1.3 China Urban and Rural Incomes Analysis 12
3.1.4 China Total Retail Sales of Consumer Goods Analysis 13
3.1.5 China Investment in Fixed Assets Analysis 14
3.1.6 China The Total Value of Imports and Exports of Goods Analysis 15
3.1.7 2014 China Macroeconomic Forecast 15
3.2 European Economic Environmental Analysis 16
3.3 United States Economic Environmental Analysis 17
3.4 Japan Economic Environmental Analysis 18
3.5 Other Regions Economic Environmental Analysis 19
3.6 Global Economic Environmental Analysis 33
Chapter Four EPDM Development Policy and Plan 34
4.1 EPDM Industry Policy Analysis 34
4.2 EPDM Industry News Analysis 34
4.3 EPDM Industry Development Trend 34
Chapter Five EPDM Manufacturing Process and Cost Structure 36
5.1 EPDM Product Specifications 36
5.2 EPDM Manufacturing Process Analysis 37
5.3 EPDM Cost Structure Analysis 37
5.4 EPDM Price Cost Gross Analysis 38
Chapter Six 2009-2014 EPDM Productions Supply Sales Demand Market Status and Forecast 41
6.1 2009-2014 EPDM Capacity Production Overview 41
6.2 2009-2014 EPDM Production Market Share Analysis 46
6.3 2009-2014 EPDM Demand Overview 52
6.4 2009-2014 EPDM Supply Demand and Shortage 53
6.5 2009-2014 EPDM Import Export Consumption 53
6.6 2009-2014 EPDM Cost Price Production Value Gross Margin 53
Chapter Seven Global EPDM Key Manufacturers Analysis 62
7.1 LANXESS 62
7.1.1 Company Profile 62
7.1.2 Product Picture and Specification 63
7.1.3 Capacity Production Price Cost Production Value 63
7.1.4 Contact Information 64
7.2 ExxonMobil Chemical 65
7.2.1 Company Profile 65
7.2.2 Product Picture and Specification 66
7.2.3 Capacity Production Price Cost Production Value 66
7.2.4 Contact Information 67
7.3 JSR Corporation 68
7.3.1 Company Profile 68
7.3.2 Product Picture and Specification 70
7.3.3 Capacity Production Price Cost Production Value 70
7.3.4 Contact Information 71
7.4 Lion Copolymer 72
7.4.1 Company Profile 72
7.4.2 Product Picture and Specification 73
7.4.3 Capacity Production Price Cost Production Value 73
7.4.4 Contact Information 74
7.5 Dow Elastomer 75
7.5.1 Company Profile 75
7.5.2 Product Picture and Specification 76
7.5.3 Capacity Production Price Cost Production Value 76
7.5.4 Contact Information 77
7.6 Kumhopolychem 78
7.6.1 Company Profile 78
7.6.2 Product Picture and Specification 80
7.6.3 Capacity Production Price Cost Production Value 80
7.6.4 Contact Information 81
7.7 Mitsui Chemical 82
7.7.1 Company Profile 82
7.7.2 Product Picture and Specification 83
7.7.3 Capacity Production Price Cost Production Value 83
7.7.4 Contact Information 84
7.8 Versalis 85
7.8.1 Company Profile 85
7.8.2 Product Picture and Specification 86
7.8.3 Capacity Production Price Cost Production Value 86
7.8.4 Contact Information 87
7.9 Sumitomo Chemical 88
7.9.1 Company Profile 88
7.9.2 Product Picture and Specification 89
7.9.3 Capacity Production Price Cost Production Value 89
7.9.4 Contact Information 91
7.10 SK Global Chemical 91
7.10.1 Company Profile 91
7.10.2 Product Picture and Specification 92
7.10.3 Capacity Production Price Cost Production Value 92
7.10.4 Contact Information 93
7.11 NizhnekamskNeftekhim Inc 94
7.11.1 Company Profile 94
7.11.2 Product Picture and Specification 95
7.11.3 Capacity Production Price Cost Production Value 95
7.11.4 Contact Information 96
7.12 China Petro (Jilin) 97
7.12.1 Company Profile 97
7.12.2 Product Picture and Specification 97
7.12.3 Capacity Production Price Cost Production Value 98
7.12.4 Contact Information 99
Chapter Eight Up and Down Stream Industry Analysis 99
8.1 Upstream Raw Materials Price Analysis 99
8.2 Upstream Equipment Market Analysis 100
8.3 Down Stream Demand Analysis 100
8.4 Industry Chain Analysis 101
Chapter Nine EPDM Marketing Channels Analysis 101
9.1 EPDM Marketing Channels Status 101
9.2 EPDM Marketing Channels Characteristic 103
9.3 EPDM Marketing Channels Development Trend 104
Chapter Ten EPDM Industry Development Trend 105
10.1 2014-2019 EPDM Capacity(10K Ton) Production(10K Ton) Overview 105
10.2 2014-2019 EPDM Production Market Share Analysis 107
10.3 2014-2019 EPDM Demand Overview 108
10.4 2014-2019 EPDM Supply Demand and Shortage 108
10.5 2014-2019 EPDM Import Export Consumption 109
10.6 2014-2019 EPDM Cost Price Production Value Gross Margin 109
Chapter Eleven EPDM Industry Development Proposals 110
11.1 Macroeconomic Development Countermeasures 110
11.1.1 Macroeconomic policy 111
11.1.2 Specific control measures 112
11.2 New Firms Enter Market Strategy 113
11.3 New Project Investment Proposals 115
11.4 Marketing Channel Strategy Proposals 115
11.5 Competitive Environment Strategy Proposals 117
Chapter Twelve EPDM New Project Investment Feasibility Analysis 118
12.1 EPDM Project SWOT Analysis 118
12.2 EPDM New Project Investment Feasibility Analysis 119
Chapter Thirteen Global and China EPDM Industry Research Conclusions 119
Tables and Figures
Figure EPDM Product Picture 1
Figure EPDM Industry Chain Structure 2
Figure 2013 Global EPDM Key Manufacturers Production Market Share 4
Figure 2013 Global EPDM Key Manufacturers Production Market Share By Country 5
Figure 2009-2019 Global EPDM Capacity Production and Growth Rate 6
Figure 2013 China EPDM Key Consumption Area 7
Figure 2014 China EPDM Key Region Production Share 7
Figure 2009-2019 China EPDM Capacity Production and Growth Rate 8
Table 2009-2014 Global EPDM Capacity Production (10K Ton) Price Cost Gross (USD/Ton) Production Value (Million USD) Gross Margin List 8
Table 2009-2014 China EPDM Capacity Production (10K Ton) Price Cost Gross (USD/Ton) Production Value (Million USD) Gross Margin List 9
Figure 2007-2013 China GDP (100 million yuan) and Growth Rate 10
Figure 2007-2013 China CPI Change Trend 11
Figure 2007-2013 China Urban and Rural Incomes (yuan) 12
Figure 2007-2013 China Total Retail Sales of Consumer Goods (100 million yuan) and Growth Rate 13
Figure 2007-2013 China Investment in Fixed Assets (100 million yuan) and Growth Rate 14
Figure 2007-2013 China The Total Value of Imports and Exports of Goods (100 million USD) and Growth Rate 15
Table 2014 China Macroeconomic Forecast Key Indicators (%) 16
Figure 2007-2013 EU27 GDP Growth Rate 16
Figure 2007-2013 EU27 HICP Index (The month of year-on-year) 17
Figure 2007-2013 United States GDP (100 million USD) 17
Figure 2007-2013 United States CPI 18
Figure 2007-2013 Japan GDP (Billion Yen) 18
Figure 2007-2013 Japan CPI (The month of year-on-year) 19
Figure 2012-2015 Russian GDP Forecast 21
Figure How have the GDP growth forecasts for Russia changed in 2013 22
Table EPDM Manufacturing Process 37
Table EPDM Cost Structure 37
Figure EPDM Cost Structure 38
Figure 2009-2014 Global EPDM Price Trend 38
Figure 2009-2014 Global EPDM Cost Trend 39
Figure 2009-2014 Global EPDM Gross Trend 39
Figure 2009-2014 China EPDM Price Trend 40
Figure 2009-2014 China EPDM Cost Trend 40
Figure 2009-2014 China EPDM Gross Trend 41
Table 2009-2014 Global Major Manufacturers EPDM Capacity and Total Capacity (10K Ton) List 41
Table 2009-2014 Global Major Manufacturers EPDM Capacity Market Share List 42
Table 2009-2014 Global Major Manufacturers EPDM Production and Total Production (10K Ton) List 43
Table 2009-2014 Global Major Manufacturers EPDM Production Market Share List 43
Figure 2009-2014 Global EPDM Capacity Production (10K Ton) and Growth Rate 44
Figure 2009-2014 Global EPDM Capacity Utilization Rate List 44
Figure 2009-2014 China EPDM Capacity Production (10K Ton) and Growth Rate 45
Figure 2009-2014 China EPDM Capacity Utilization Rate List 45
Figure 2009 Global Major Manufacturers EPDM Production Market Share 46
Figure 2010 Global Major Manufacturers EPDM Production Market Share 47
Figure 2011 Global Major Manufacturers EPDM Production Market Share 48
Figure 2012 Global Major Manufacturers EPDM Production Market Share 49
Figure 2013 Global Major Manufacturers EPDM Production Market Share 50
Figure 2014 Global Major Manufacturers EPDM Production Market Share 51
Figure 2009-2014 Global EPDM Demand (10K Ton) and Growth Rate 52
Figure 2009-2014 China EPDM Demand (10K Ton) and Growth Rat 52
Table 2009-2014 Global EPDM Supply Demand Shortage (10K Ton) List 53
Table 2009-2014 China EPDM Supply Demand Shortage (10K Ton) List 53
Table 2009-2014 China EPDM Production Import Export (10K Ton) Consumption List 53
Table 2009-2014 Global Major Manufacturers EPDM Price (USD/Ton) List 53
Table 2009-2014 Global Major Manufacturers EPDM Gross Margin List 54
Table 2009-2014 Global Major Manufacturers EPDM Production Value (Million USD) List 54
Table 2009-2014 Global Major Manufacturers EPDM Production Value Share List 55
Figure 2009 Global Major Manufacturers EPDM Production Value Share 56
Figure 2010 Global Major Manufacturers EPDM Production Value Share 57
Figure 2011 Global Major Manufacturers EPDM Production Value Share 58
Figure 2012 Global Major Manufacturers EPDM Production Value Share 59
Figure 2013 Global Major Manufacturers EPDM Production Value Share 60
Figure 2014 Global Major Manufacturers EPDM Production Value Share 61
Table 2009-2014 Global EPDM Capacity Production (10K Ton) Price Cost Gross (USD/Ton) Production Value (Million USD) Gross Margin List 61
Table 2009-2014 China EPDM Capacity Production (10K Ton) Price Cost Gross (USD/Ton) Production Value (Million USD) Gross Margin List 62
Figure LANXESS EPDM Product Picture 63
Table 2009-2014 LANXESS EPDM Product Capacity Production (10K Ton) Price Cost Gross ($/Ton) Production Value ($Million) Gross Margin List 63
Figure 2009-2014 LANXESS EPDM Product Capacity Production (10K Ton) and Growth Rate 64
Figure 2009-2014 LANXESS EPDM Product Production Global Market Share 64
Figure ExxonMobil Chemical EPDM Product Picture 66
Table 2009-2014 ExxonMobil Chemical EPDM Product Capacity Production (10K Ton) Price Cost Gross ($/Ton) Production Value ($Million) Gross Margin List 66
Figure 2009-2014 ExxonMobil Chemical EPDM Product Capacity Production (10K Ton) and Growth Rate 67
Figure 2009-2014 ExxonMobil Chemical EPDM Product Production Global Market Share 67
Figure JSR Corporation EPDM Product Picture 70
Table 2009-2014 JSR Corporation EPDM Product Capacity Production (10K Ton) Price Cost Gross ($/Ton) Production Value ($Million) Gross Margin List 70
Figure 2009-2014 JSR Corporation EPDM Product Capacity Production (10K Ton) and Growth Rate 71
Figure 2009-2014 JSR Corporation EPDM Product Production Global Market Share 71
Figure Lion Copolymer EPDM Product Picture 73
Table 2009-2014 Lion Copolymer EPDM Product Capacity Production (10K Ton) Price Cost Gross ($/Ton) Production Value ($Million) Gross Margin List 73
Figure 2009-2014 Lion Copolymer EPDM Product Capacity Production (10K Ton) and Growth Rate 74
Figure 2009-2014 Lion Copolymer EPDM Product Production Global Market Share 74
Figure Dow Elastomer EPDM Product Picture 76
Table 2009-2014 Dow Elastomer EPDM Product Capacity Production (10K Ton) Price Cost Gross ($/Ton) Production Value ($Million) Gross Margin List 76
Figure 2009-2014 Dow Elastomer EPDM Product Capacity Production (10K Ton) and Growth Rate 77
Figure 2009-2014 Dow Elastomer EPDM Product Production Global Market Share 77
Figure Kumhopolychem EPDM Product Picture 80
Table 2009-2014 Kumhopolychem EPDM Product Capacity Production (10K Ton) Price Cost Gross ($/Ton) Production Value ($Million) Gross Margin List 80
Figure 2009-2014 Kumhopolychem EPDM Product Capacity Production (10K Ton) and Growth Rate 81
Figure 2009-2014 Kumhopolychem EPDM Product Production Global Market Share 81
Figure Mitsui Chemical EPDM Product Picture 83
Table 2009-2014 Mitsui Chemical EPDM Product Capacity Production (10K Ton) Price Cost Gross ($/Ton) Production Value ($Million) Gross Margin List 83
Figure 2009-2014 Mitsui Chemical EPDM Product Capacity Production (10K Ton) and Growth Rate 84
Figure 2009-2014 Mitsui Chemical EPDM Product Production Global Market Share 84
Figure Versalis EPDM Product Picture 86
Table 2009-2014 Versalis EPDM Product Capacity Production (10K Ton) Price Cost Gross ($/Ton) Production Value ($Million) Gross Margin List 86
Figure 2009-2014 Versalis EPDM Product Capacity Production (10K Ton) and Growth Rate 87
Figure 2009-2014 Versalis EPDM Product Production Global Market Share 87
Figure Sumitomo Chemical EPDM Product Picture 89
Table 2009-2014 Sumitomo Chemical EPDM Product Capacity Production (10K Ton) Price Cost Gross ($/Ton) Production Value ($Million) Gross Margin List 89
Figure 2009-2014 Sumitomo Chemical EPDM Product Capacity Production (10K Ton) and Growth Rate 90
Figure 2009-2014 Sumitomo Chemical EPDM Product Production Global Market Share 90
Figure SK Global Chemical EPDM Product Picture 92
Table 2009-2014 SK Global Chemical EPDM Product Capacity Production (10K Ton) Price Cost Gross ($/Ton) Production Value ($Million) Gross Margin List 92
Figure 2009-2014 SK Global Chemical EPDM Product Capacity Production (10K Ton) and Growth Rate 93
Figure 2009-2014 SK Global Chemical EPDM Product Production Global Market Share 93
Figure NizhnekamskNeftekhim Inc EPDM Product Picture 95
Table 2009-2014 NizhnekamskNeftekhim Inc EPDM Product Capacity Production (10K Ton) Price Cost Gross ($/Ton) Production Value ($Million) Gross Margin List 95
Figure 2009-2014 NizhnekamskNeftekhim Inc EPDM Product Capacity Production (10K Ton) and Growth Rate 96
Figure 2009-2014 NizhnekamskNeftekhim Inc EPDM Product Production Global Market Share 96
Figure China Petro EPDM Product Picture 97
Table 2009-2014 China Petro EPDM Product Capacity Production (10K Ton) Price Cost Gross ($/Ton) Production Value ($Million) Gross Margin List 98
Figure 2009-2014 China Petro EPDM Product Capacity Production (10K Ton) and Growth Rate 98
Figure 2009-2014 China Petro EPDM Product Production Global Market Share 99
Figure Crude Oil Price Trend from 2009-2014 99
Figure EPDM domestic sales channels 101
Figure EPDM distribution channels abroad 102
Table 2014-2019 Global and China EPDM Capacity (10K Ton) Overview 105
Table 2014-2019 Global and China EPDM Production (10K Ton) Overview 105
Figure 2014-2019 Global EPDM Capacity Production (10K Ton) and Growth Rate 106
Figure 2014-2019 China EPDM Capacity Production (10K Ton) and Growth Rate 106
Table 2014-2019 Global Major Manufacturers EPDM Capacity Market Share List 107
Table 2014-2019 Global Major Manufacturers EPDM Production Market Share List 107
Table 2014-2019 Global and China EPDM Demand (10K Ton) Overview 108
Table 2014-2019 Global EPDM Supply Demand and Shortage (10K Ton) List 108
Table 2014-2019 China EPDM Supply Demand and Shortage (10K Ton) List 108
Figure 2014-2019 Global and China EPDM Demand (10K Ton) and Growth Rate 109
Table 2014-2019 China EPDM Import Export Consumption (10K Ton) List 109
Table 2014-2019 Global EPDM Capacity Production (10K Ton) Price Cost Gross (USD/Ton) Production Value (Million USD) Gross Margin List 109
Table 2014-2019 China EPDM Capacity Production (10K Ton) Price Cost Gross (USD/Ton) Production Value (Million USD) Gross Margin List 110
Table New Firms Enter Market Strategy 113
Table New Project Investment Proposals 115
Table EPDM Marketing Channel Strategy Proposals 115
Table Competitive Environment Strategy Proposals 116
Figure EPDM marketing strategy recommendations 117
Table EPDM New Project SWOT Analysis 118
Table Annual 50000 tons EPDM New Project Investment Feasibility Analysis 119
?本報告所有內容受法律保護,中華人民共和國涉外調查許可證:國統涉外證字第1454號。 本報告由中商產業研究院出品,報告版權歸中商產業研究院所有。本報告是中商產業研究院的研究與統計成果,報告為有償提供給購買報告的客戶內部使用。未獲得中商產業研究院書面授權,任何網站或媒體不得轉載或引用,否則中商產業研究院有權依法追究其法律責任。如需訂閱研究報告,請直接聯系本網站,以便獲得全程優質完善服務。 本報告目錄與內容系中商產業研究院原創,未經本公司事先書面許可,拒絕任何方式復制、轉載。 在此,我們誠意向您推薦鑒別咨詢公司實力的主要方法。
4月25日,湖南省東安縣委副書記、縣長蔣華一行蒞臨我院考察交流,會上蔣縣長對我院編制的《東安縣熱能綜合...
4月25日,湖南省東安縣委副書記、縣長蔣華一行蒞臨我院考察交流,會上蔣縣長對我院編制的《東安縣熱能綜合...
查看詳情
4月23日,中共畢節委組織部、畢節市投資促進局在畢節市委黨校舉辦全市產業大招商專題培訓會。培訓會上,中...
4月23日,中共畢節委組織部、畢節市投資促進局在畢節市委黨校舉辦全市產業大招商專題培訓會。培訓會上,中...
查看詳情
4月15日,新疆維吾爾自治區哈密市人民政府黨組成員、副市長一行李建勇蒞臨我院考察指導,會上李市長介紹了...
4月15日,新疆維吾爾自治區哈密市人民政府黨組成員、副市長一行李建勇蒞臨我院考察指導,會上李市長介紹了...
查看詳情
4月9日,甘肅省工業和信息化廳副廳長王永慶一行蒞臨我院考察指導,會上王廳長介紹了甘肅省的產業基礎及現狀...
4月9日,甘肅省工業和信息化廳副廳長王永慶一行蒞臨我院考察指導,會上王廳長介紹了甘肅省的產業基礎及現狀...
查看詳情
4月2日至3日,貴州省商務廳在貴陽市舉辦2024年全省商務系統項目專題培訓會。培訓會上,中商情報網聯合創始...
4月2日至3日,貴州省商務廳在貴陽市舉辦2024年全省商務系統項目專題培訓會。培訓會上,中商情報網聯合創始...
查看詳情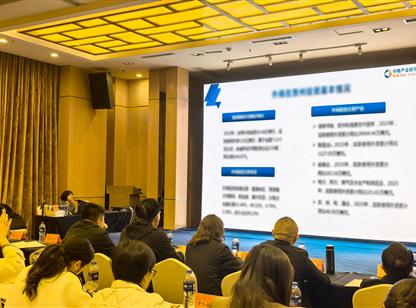
3月19日,貴州省商務廳組織召開《2024 年貴州省外資工作會暨外商投資業務培訓會》。培訓會上,我院項目老師...
3月19日,貴州省商務廳組織召開《2024 年貴州省外資工作會暨外商投資業務培訓會》。培訓會上,我院項目老師...
查看詳情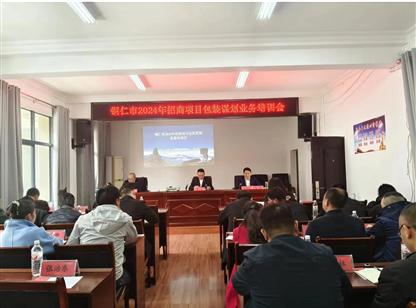
3月14日,銅仁市投資促進局組織召開全市2024年招商項目謀劃業務培訓會。培訓會上,中商情報網聯合創始人、...
3月14日,銅仁市投資促進局組織召開全市2024年招商項目謀劃業務培訓會。培訓會上,中商情報網聯合創始人、...
查看詳情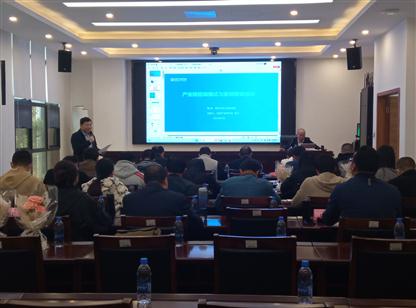
3月8日,深圳市坪山區《2024年“拓展產業空間,優化營商環境”》專題研討班在坪山區委黨校舉行,中商產業董...
3月8日,深圳市坪山區《2024年“拓展產業空間,優化營商環境”》專題研討班在坪山區委黨校舉行,中商產業董...
查看詳情